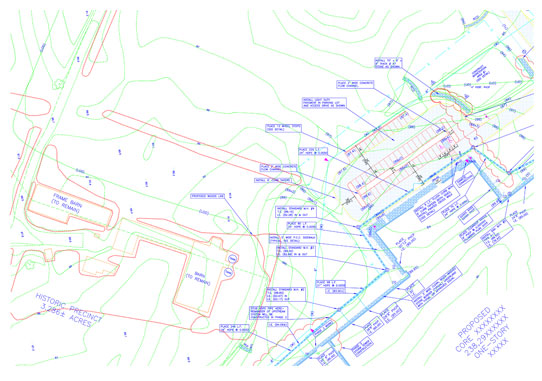
Contour Mapping
Contour analysis depicts the weather and oceanic conditions of a specific environmental situation. This analysis is used by ecologists and weather forecast departments to forecast the weather.
Contour maps showcase information about oceanic and atmospheric data. Actual interpretation of this data provides the basis of data mapping. Meteorologists and oceanographers have noted that variables like temperature, pressure, wind velocity, salinity and clouds vary with time or with reference to any other variable. Various types of maps, stats and charts are taken in use to depict these variables. Contour drawing depict size, shape and elevation of various physical features on the ground.
Confident and correct analysis of data is essential. Contour drawings are useful in performing the following tasks:
• track upcoming changes in atmosphere and ocean fronts
• locate regions of severe storms, thunderstorms and floods
• keep an eye on hurricanes, tsunamis, etc
• check water movement in oceans.


